🤖 Ask My AI
Ask my AI about my research, projects, or how I think about problems.
✨ Featured Projects
GPT‑2 Medium MLP Efficient LLM Inference
Method Summary
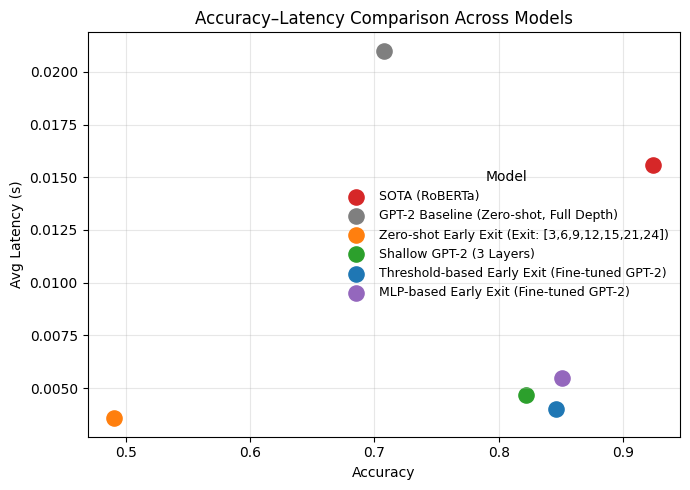
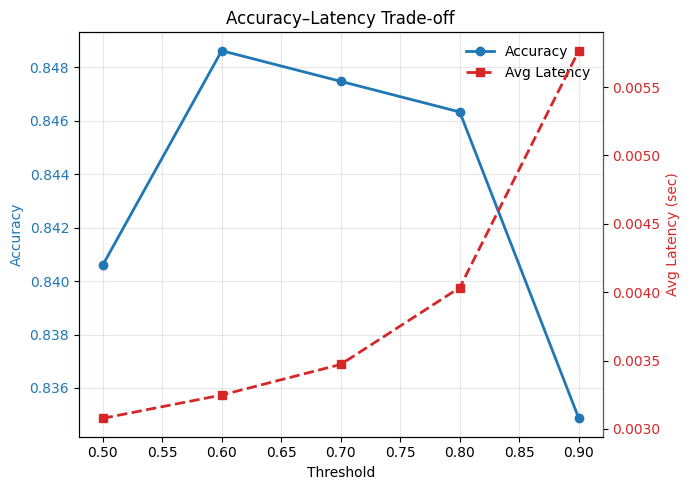
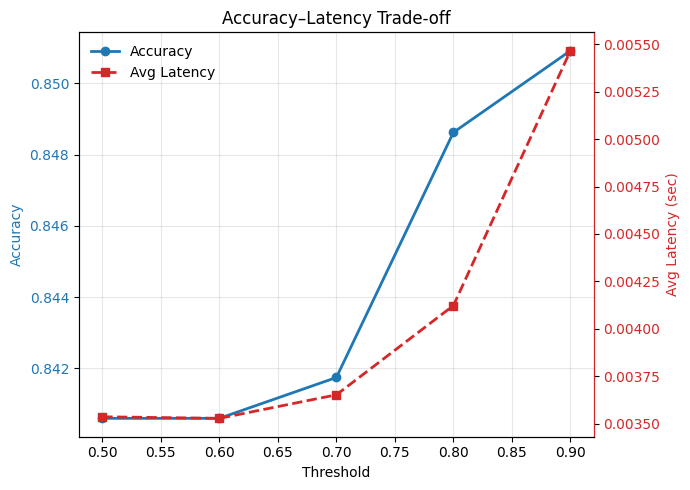
Introduced confidence and MLP-based early-exit policies, evaluated across multiple checkpoints, and compared against full‑depth inference for latency/accuracy tradeoffs.
Impact Summary
Fine‑tuned early‑exit GPT‑2 boosts accuracy to 84.6–85.1% while cutting latency to 0.00403–0.00547s per sample (≈74–81% reduction, ~4–5× faster) compared to standard GPT‑2.
NLP Financial Text Quant Signals Backtests
| MTS Method | Mean | Sharpe |
|---|---|---|
| MTS roll | −8.37 | −0.36 |
| MTS w var | −0.01 | −0.16 |
| MTS w freq | −0.06 | −0.29 |
| MTS KL | +0.03 | 0.46 |
| MTS Cosine | +0.12 | 0.54 |
Data Insights
- Strongest narrative change (max |Δ|) carries the strongest predictive information.
- Balanced directional accuracy ~54% Up and ~51% Down predictions.
- Firms average ~15 feature changes per quarter; narratives are highly dynamic.
- Higher future‑oriented firms saw ~30.4% returns vs ~7.1% for less forward‑looking firms.
- Subjective (top quartile) ~50.8% returns vs Objective ~9.4%.
Result Highlights
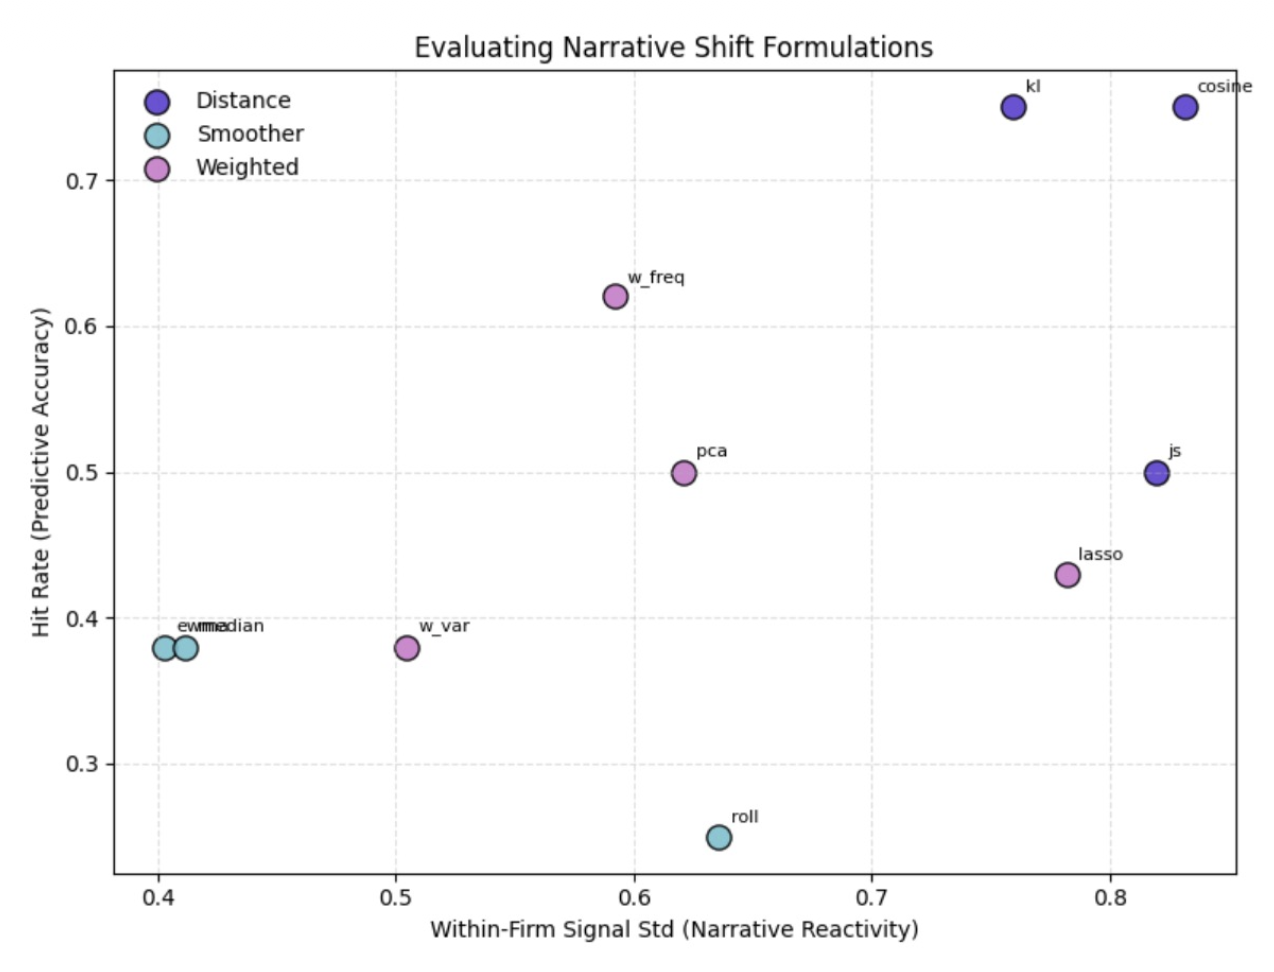
- Distance‑based measures (KL, cosine) delivered the strongest signals.
- PCA blend of cosine + variance improved robustness and cumulative returns.
- Factor regressions show positive alpha beyond market, value, and momentum.
Method Summary
Constructed Moving Target Scores (rolling, EWMA, median, variance, frequency, KL, cosine) to quantify quarter‑to‑quarter shifts. Distance‑based metrics produced the strongest signals, and a PCA composite of cosine + variance improved robustness.
Impact Summary
Signals based on KL divergence and cosine similarity delivered the most consistent performance. The best MTS variants reached Sharpe 0.54 with ~75% hit rates, and factor regressions showed positive alpha when narrative signals added information beyond traditional risk factors.
HML SMB Factor Model Replication
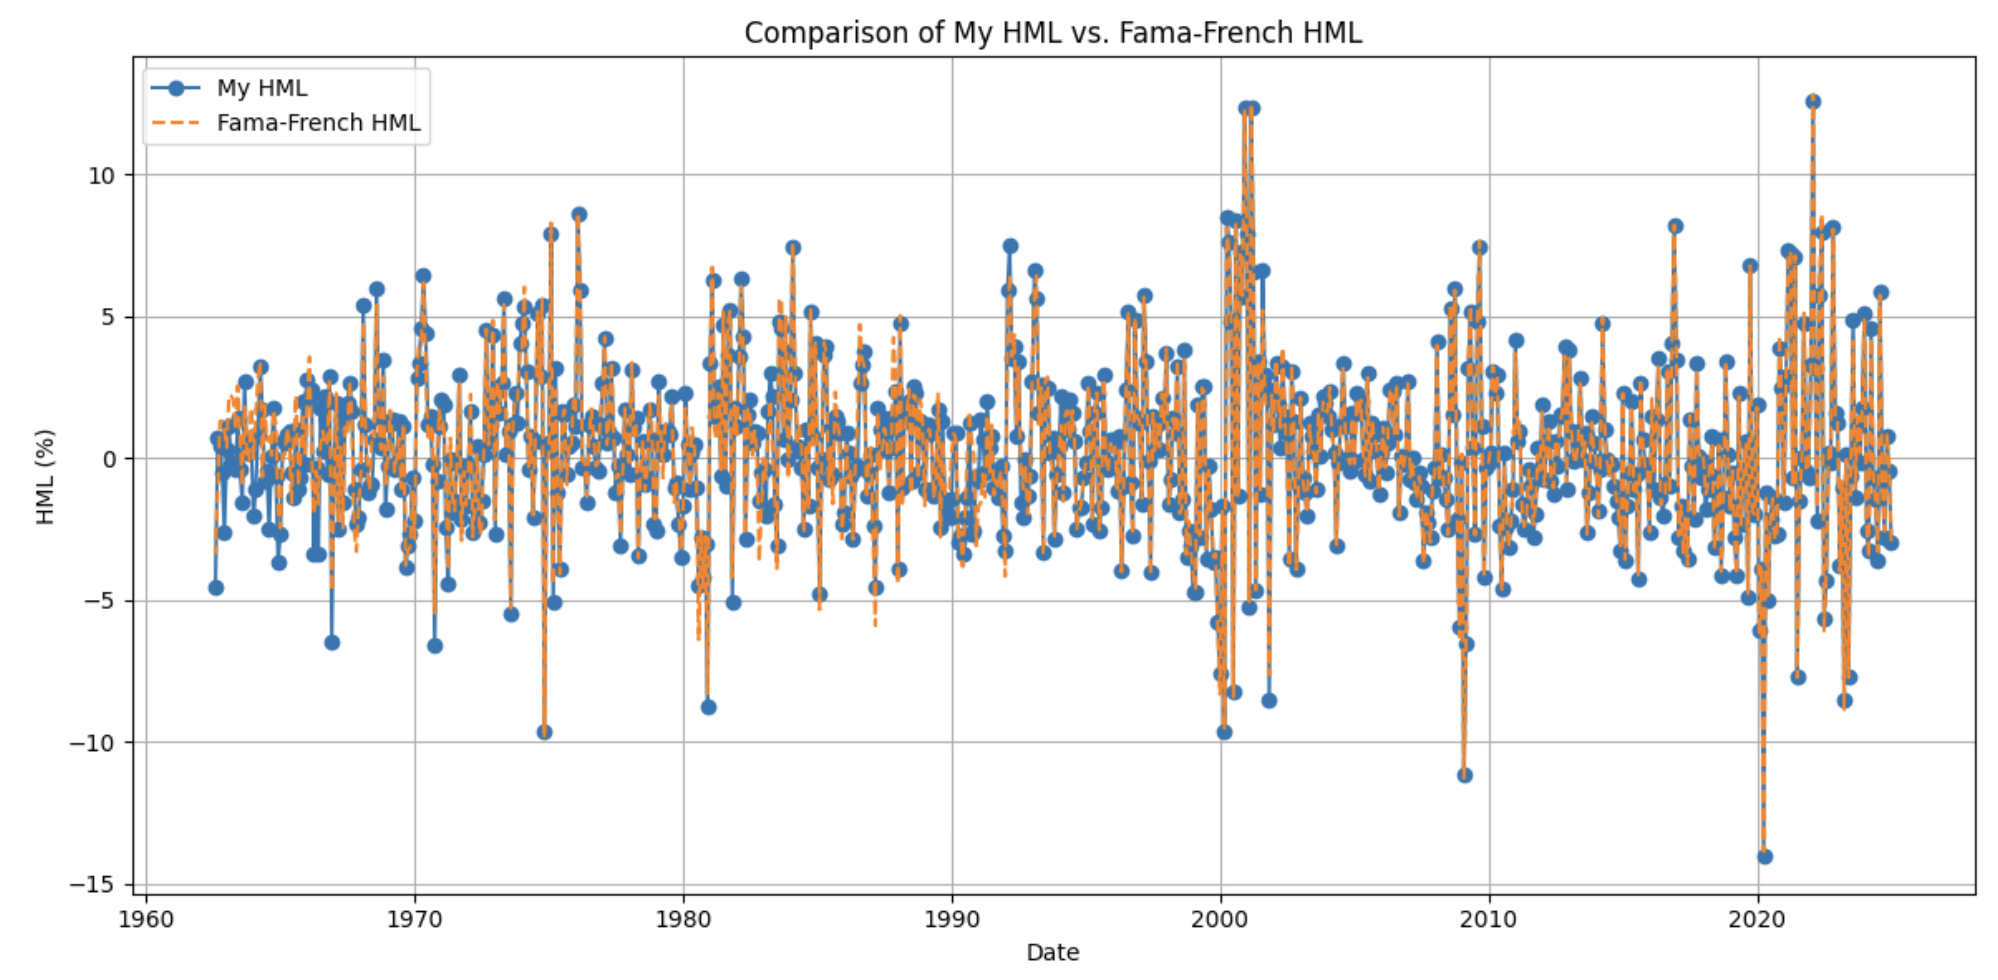
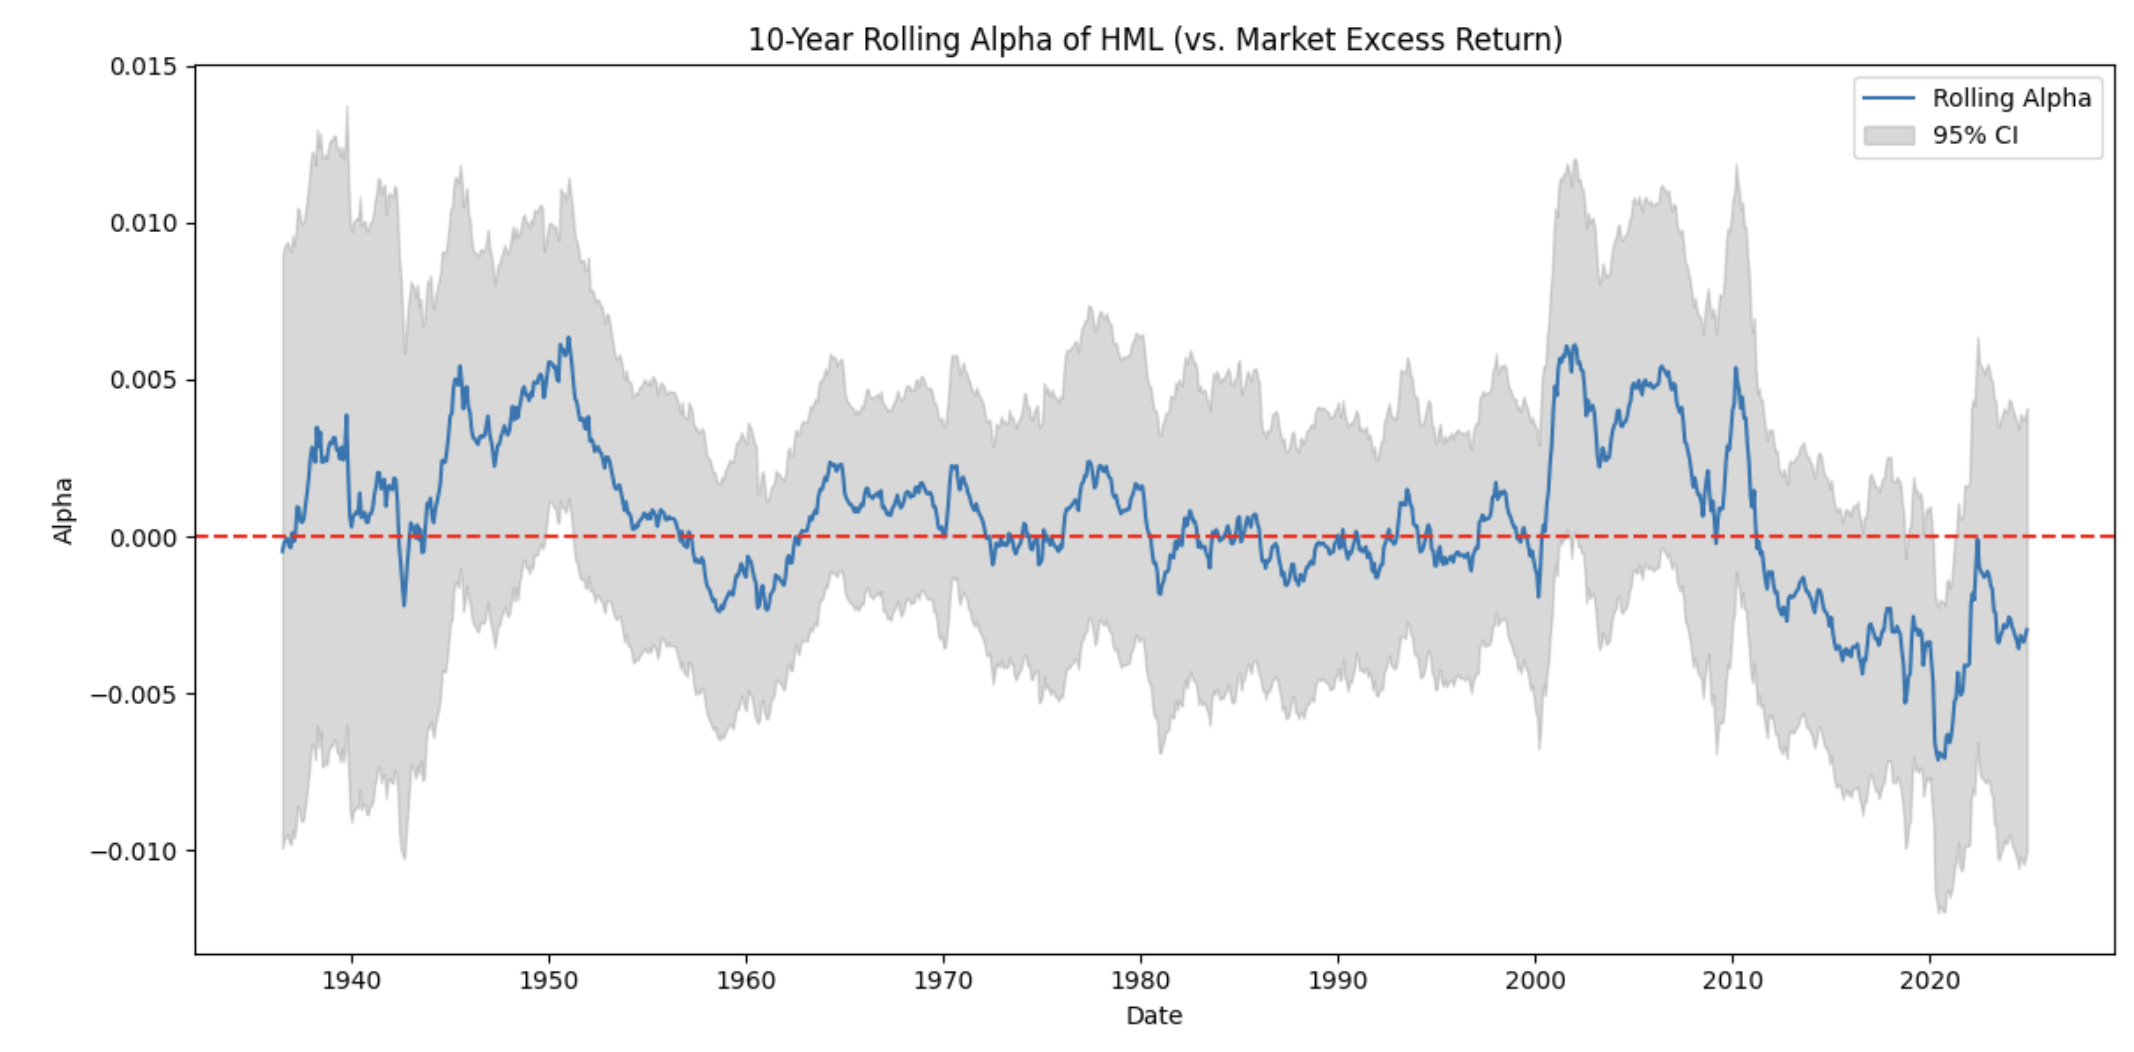
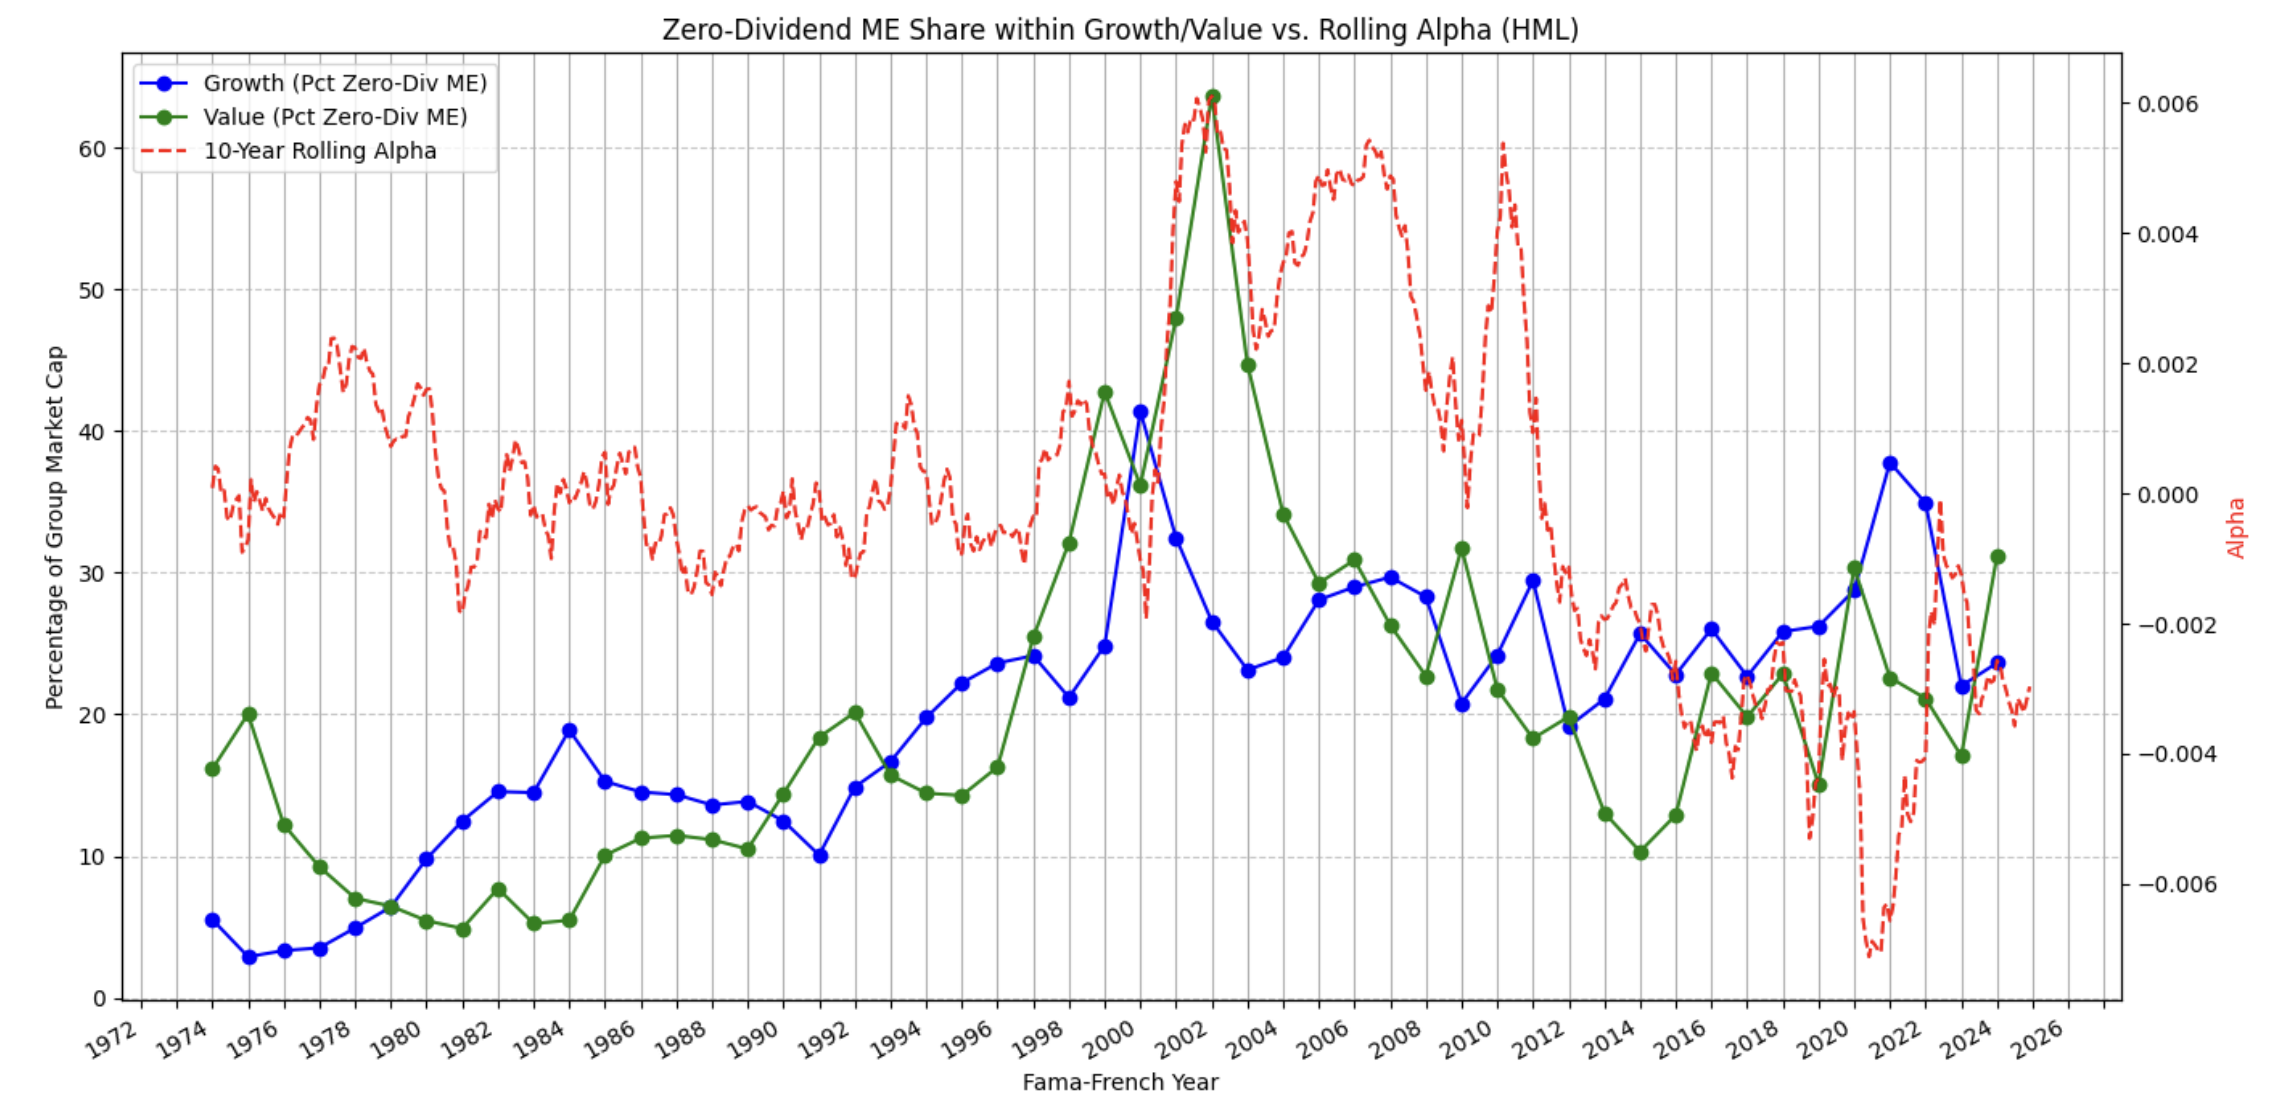
Method Summary
Constructed factor portfolios using standard HML/SMB definitions, validated time‑series behavior, and analyzed rolling alpha trends for value vs. growth regimes.
🎥 YouTube
DeepSeek’s mHC Explained: How It Improves LLMs
Stanford Alpaca: Revolutionizing AI
Understanding Self-Attention: The Core
✍️ Articles
🎓 College Projects
📦 LightResNet
A lightweight adaptation of the ResNet architecture from Microsoft Research designed for efficient image classification.
🌍 Computing System Architecture
Implement single stage and five stage processor for RISC-V architecture.
🎮 Machine Learning
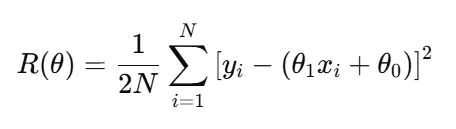
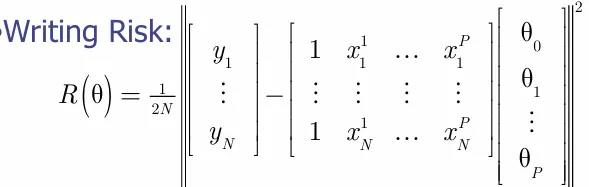
Assessments on mathematical foundation behind machine learning. Used MATLAV for image analysis, regression and empirical risk.